We’ve been keeping an eye on the reported cases coming out of our kids’ school district, Leander ISD. Living in Texas, the mitigation steps taken to contain the spread of COVID-19 is minimal:
- an unenforced mask mandate
- no social distancing
- no pods / containment strategies for limiting contact in secondary school
- no staggered bell schedules to reduce hallway crowding
- no outside lunch options available for increased distancing
The relative lack of mitigation efforts alarmed us, so we started taking a closer look at what data was available from the district that we could use to better inform ourselves of what was going on in our school, and the schools around us.
Continue reading
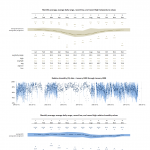 I am a dart frog addict…er…hobbyist. You can read more about my involvement in the hobby here, but one aspect of the hobby that intersects with my analytics background is weather data. I try to locate weather stations near the regions in South America where the frogs I keep were originally collected. This has led to some interesting visualizations, including this one, regional weather data for Sao Lourenco: